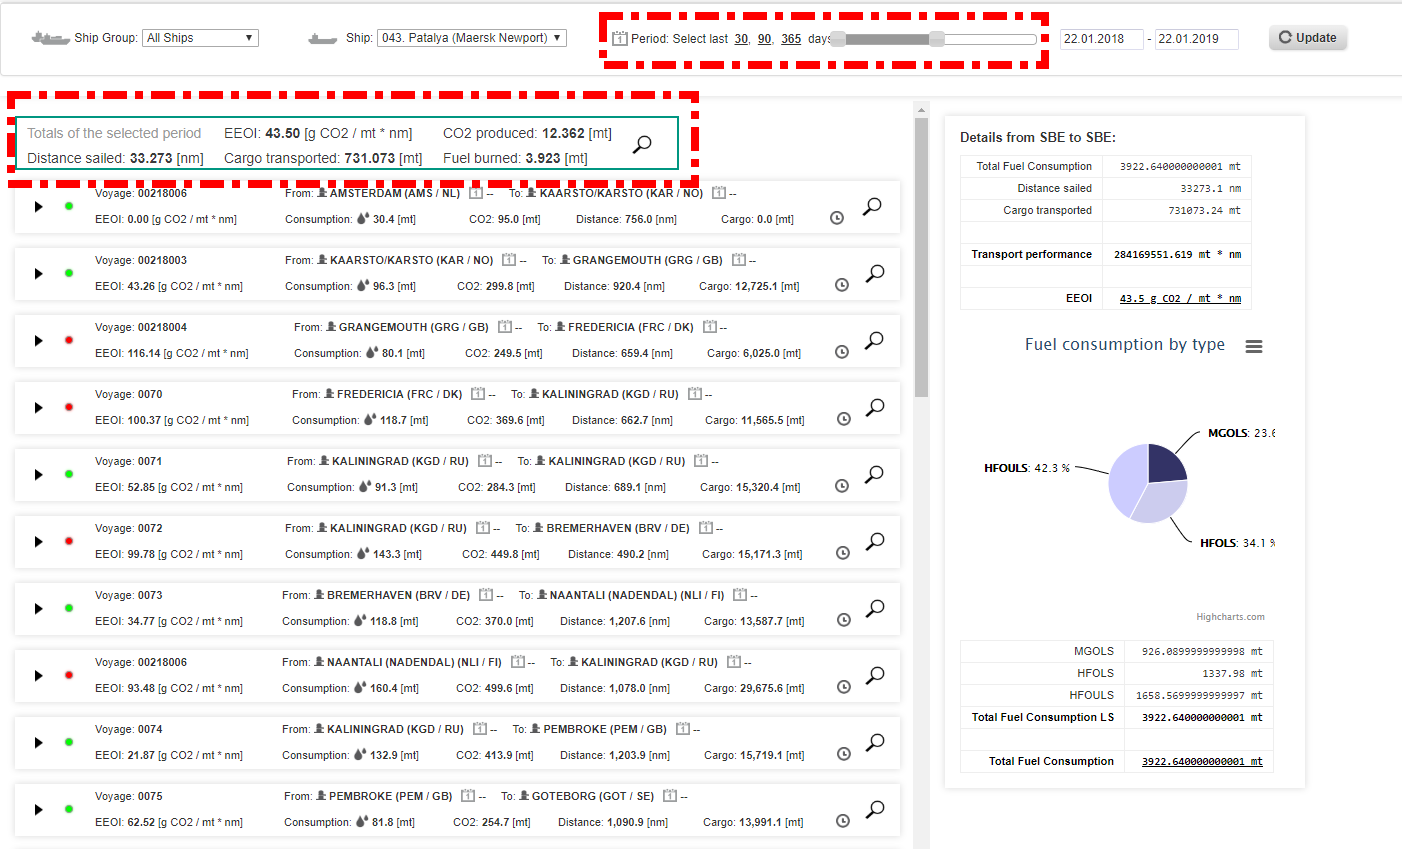
This is another graphical visualization of the Fuel Management Details analysis which is based on the fuel management report. This analysis displays the fuel consumptions and the EEOI based on the different voyages of a selected vessel. This analysis requires the ROBs at SBE, BOSP, EOSP, and FWE, the distances, and the corresponding time stamps.
Below is the default view when clicking on the menu Fuel Consumption Overview.
Filter
Chart
![]() 2. After clicking on update the voyages of the chosen timeframe are shown. Furthermore, you can find information about the fuel which was consumed by the ship.
2. After clicking on update the voyages of the chosen timeframe are shown. Furthermore, you can find information about the fuel which was consumed by the ship.
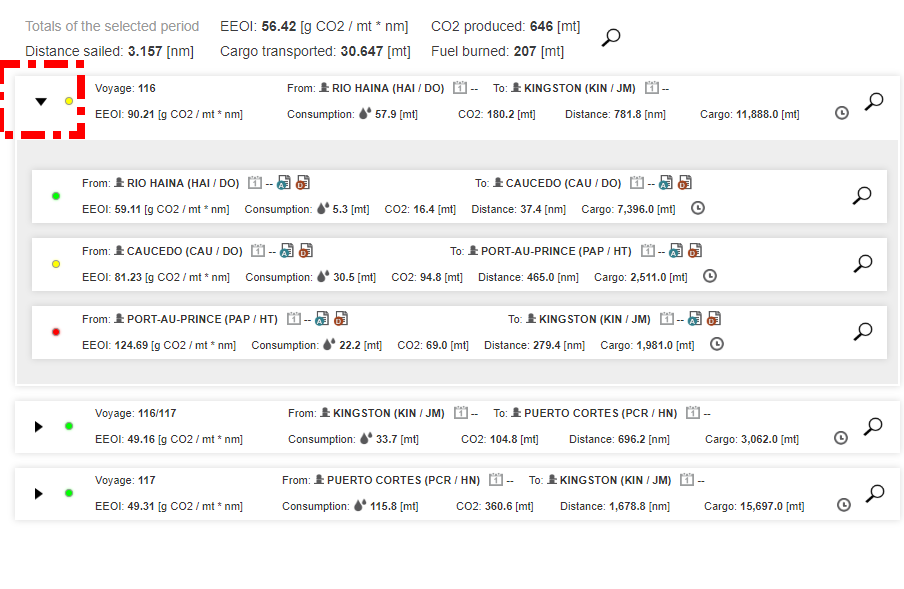
This site contains a list of the voyages the vessel made during the selected time frame. For each voyage, the start and end port call, the voyage number, the EEOI, the emitted CO2, the total distance sailed, the total transported cargo and the burned fuel are shown in one 'box'.

![]() 3. Each voyage can be extended to the different legs of a voyage. If you click on the arrow on the left side, the legs of a voyage are listed below the voyage summary.
3. Each voyage can be extended to the different legs of a voyage. If you click on the arrow on the left side, the legs of a voyage are listed below the voyage summary.
![]() 4. By clicking on the forms you can open the departure or arrival report for the voyage.
4. By clicking on the forms you can open the departure or arrival report for the voyage.
![]() 5. When you hover with the mouse above certain parts you get additional information about the meaning of the data.
5. When you hover with the mouse above certain parts you get additional information about the meaning of the data.
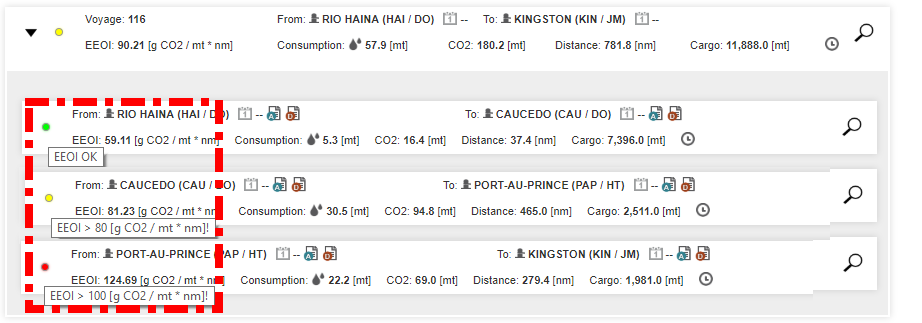
![]() 6. The different colored dots in red, yellow and green, give you a quick overview of the Energy Efficiency Operational Indicator (EEOI) in regards to the voyage. When hovering above the color you can get more detailed information.
6. The different colored dots in red, yellow and green, give you a quick overview of the Energy Efficiency Operational Indicator (EEOI) in regards to the voyage. When hovering above the color you can get more detailed information.
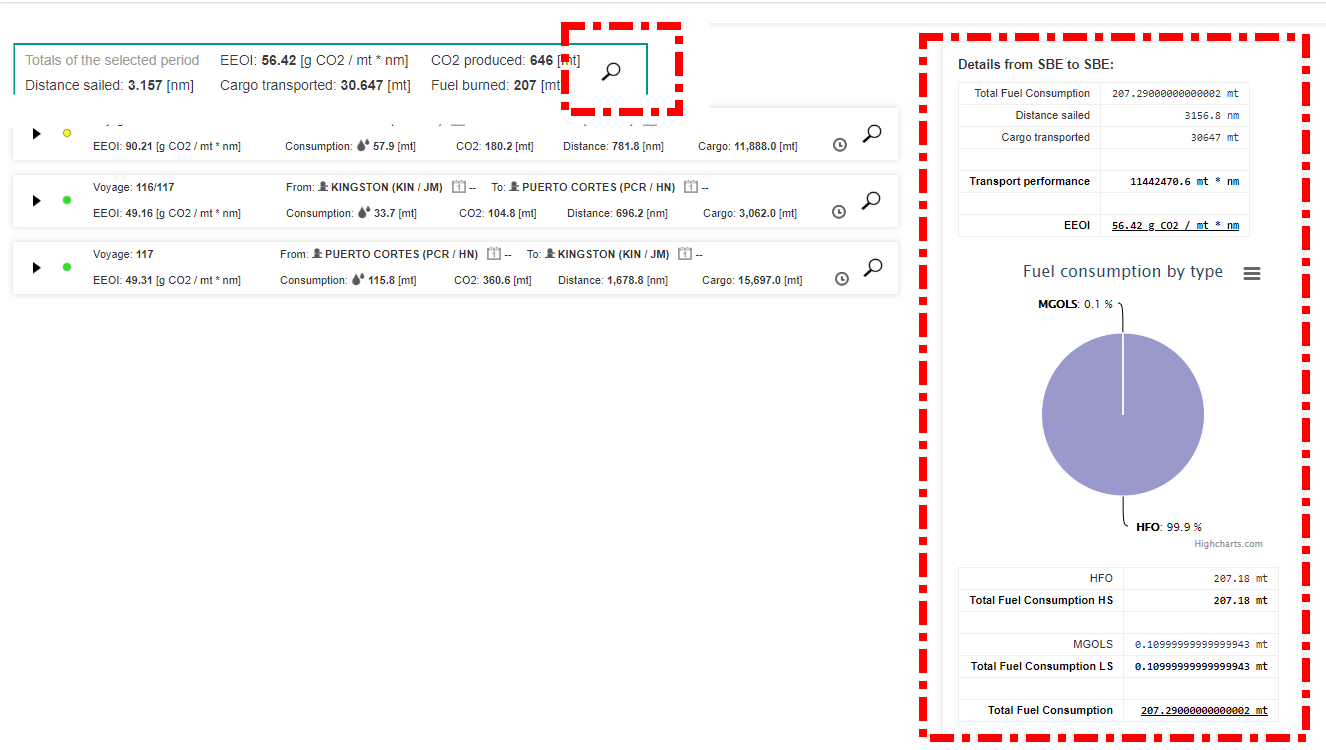
![]() 7. By clicking on the magnifying glass, new information is shown with details about the SBE.
7. By clicking on the magnifying glass, new information is shown with details about the SBE.
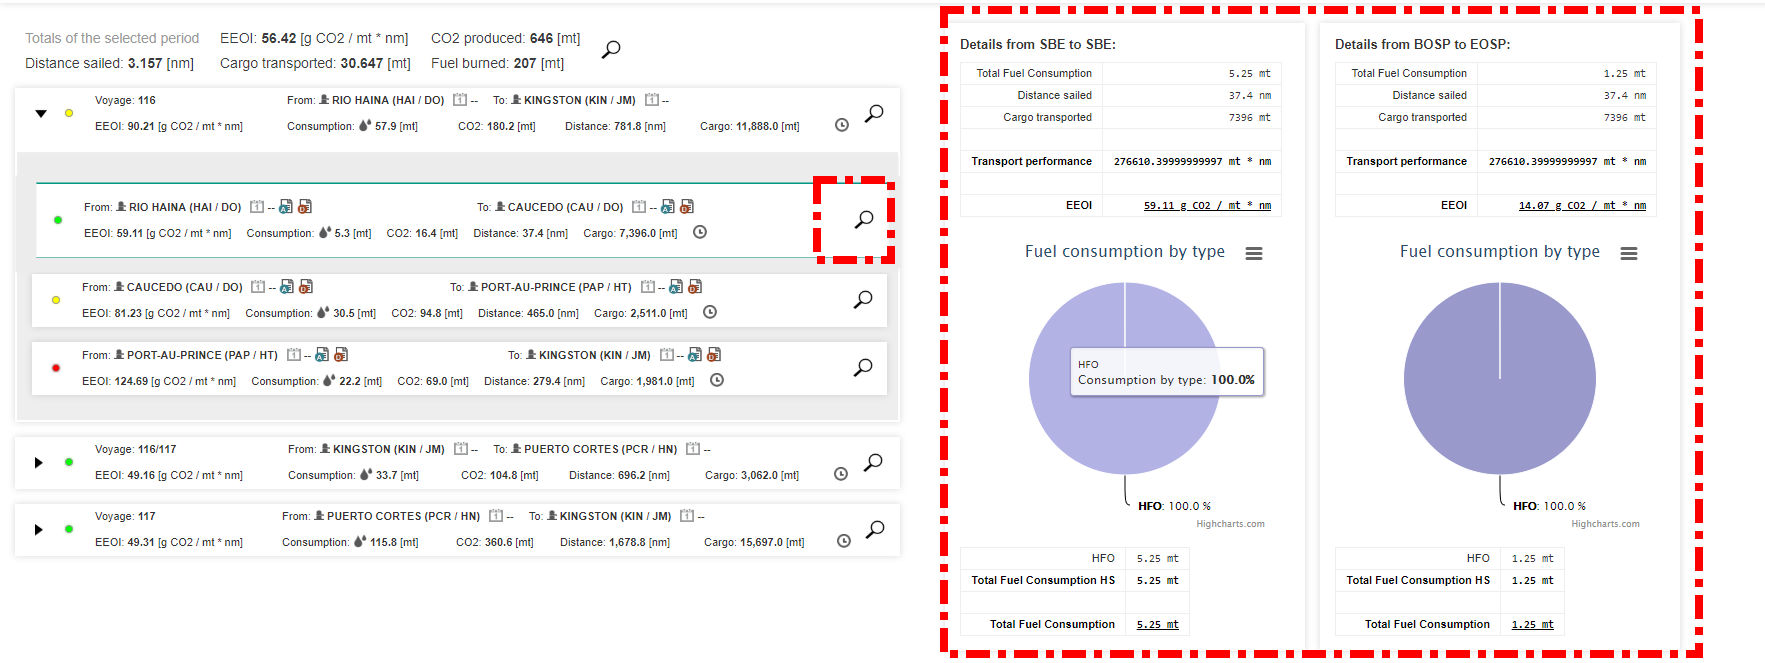
![]() 8. Similarly, by clicking on the magnifying glass of a part of the voyage, you get a more detailed view.
8. Similarly, by clicking on the magnifying glass of a part of the voyage, you get a more detailed view.
The charts show the consumptions for sea passage (BOSP - EOSP) and the entire voyage (SBE - SBE) including the approach and laytime.
![]() 9. When you change the timeframe, more voyages are shown.
9. When you change the timeframe, more voyages are shown.


