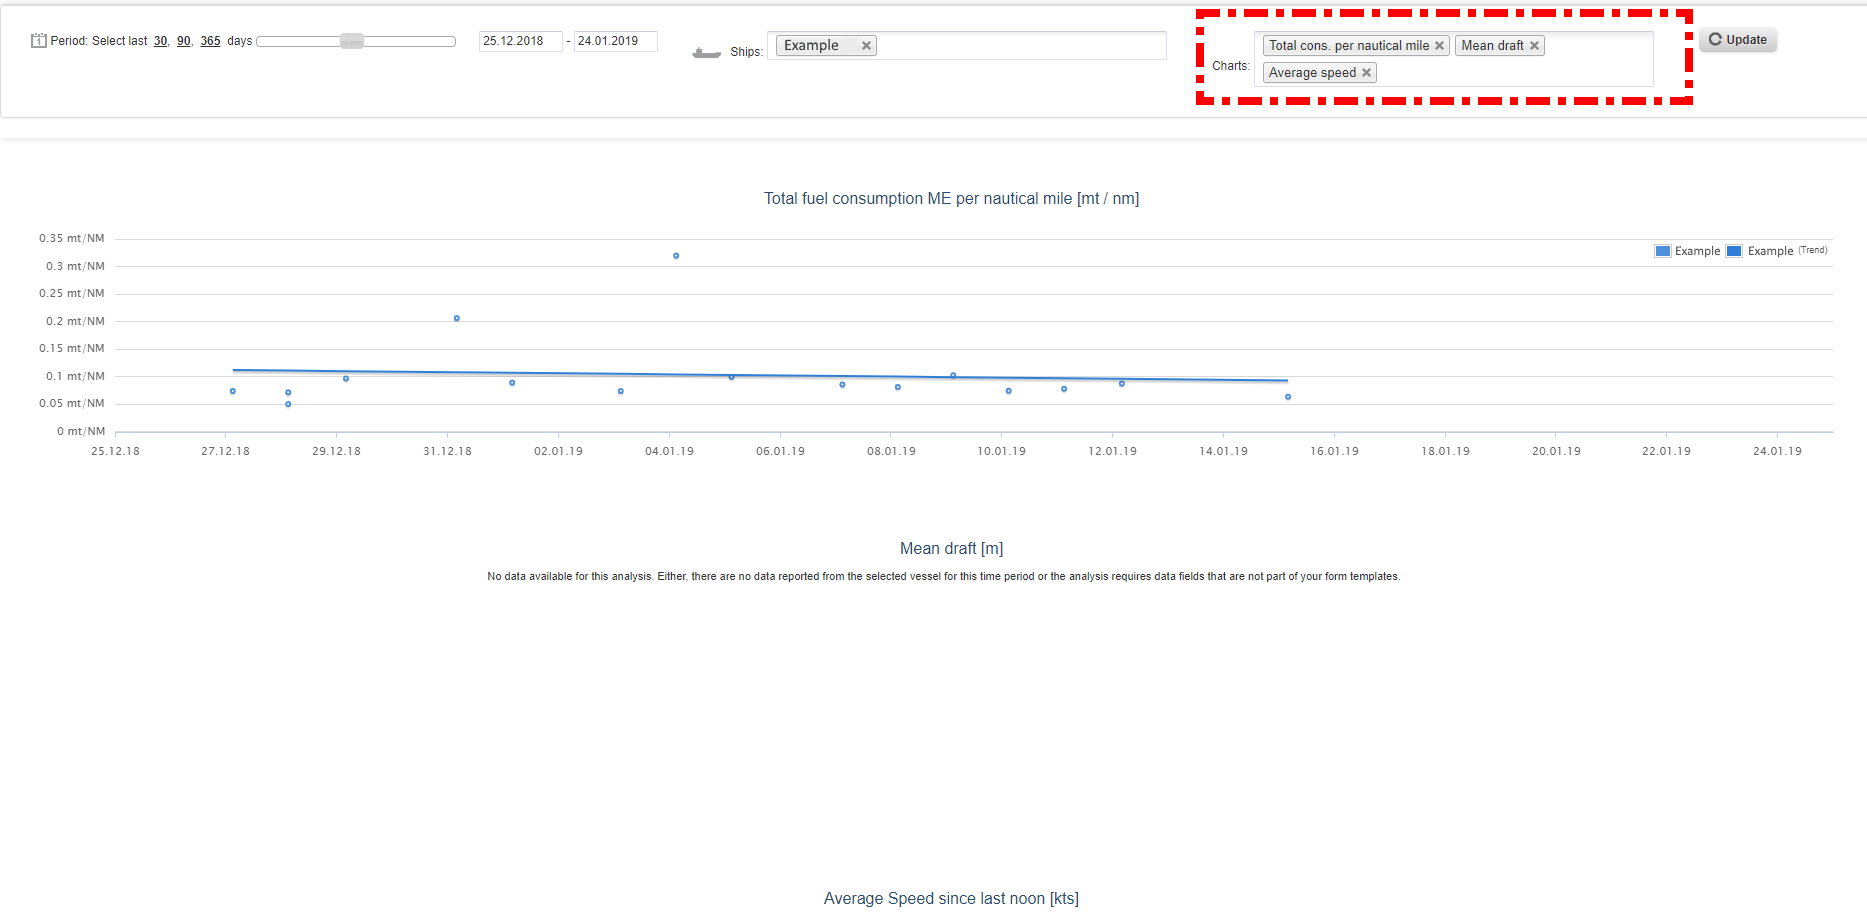
This analysis shows the fuel consumption details based on daily reporting, e.g. by performance reports. The first chart shows the specific fuel consumption of the main engine (ME) per transported ton and sailed mile.
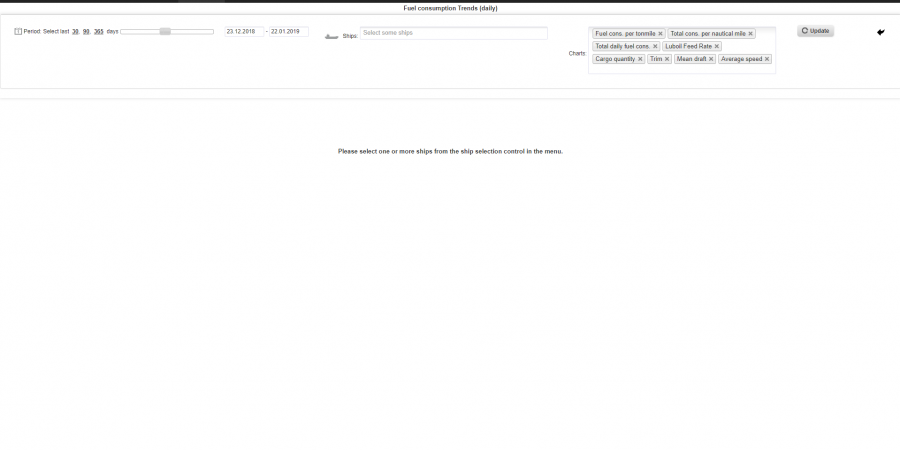
Below is the default view when opening the menu Fuel Consumption Trend (daily).
Filter
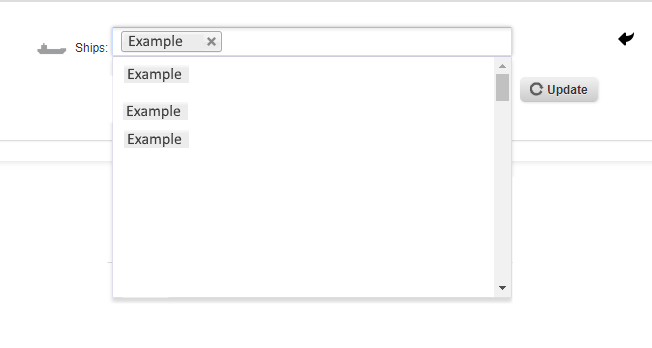
1. First, you need to choose a ship, for which you want to see performance data.
2. You can choose between one and up to eight ships.
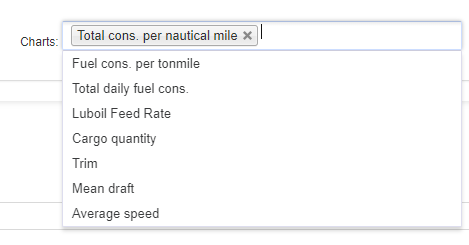
3. Under “chart”, you can choose the charts you need for your analysis. By default, all charts are activated.
4. By clicking on the small cross you can deactivate charts you do not need for your analysis.
5. You can also add them again through the drop-down menu.
Chart
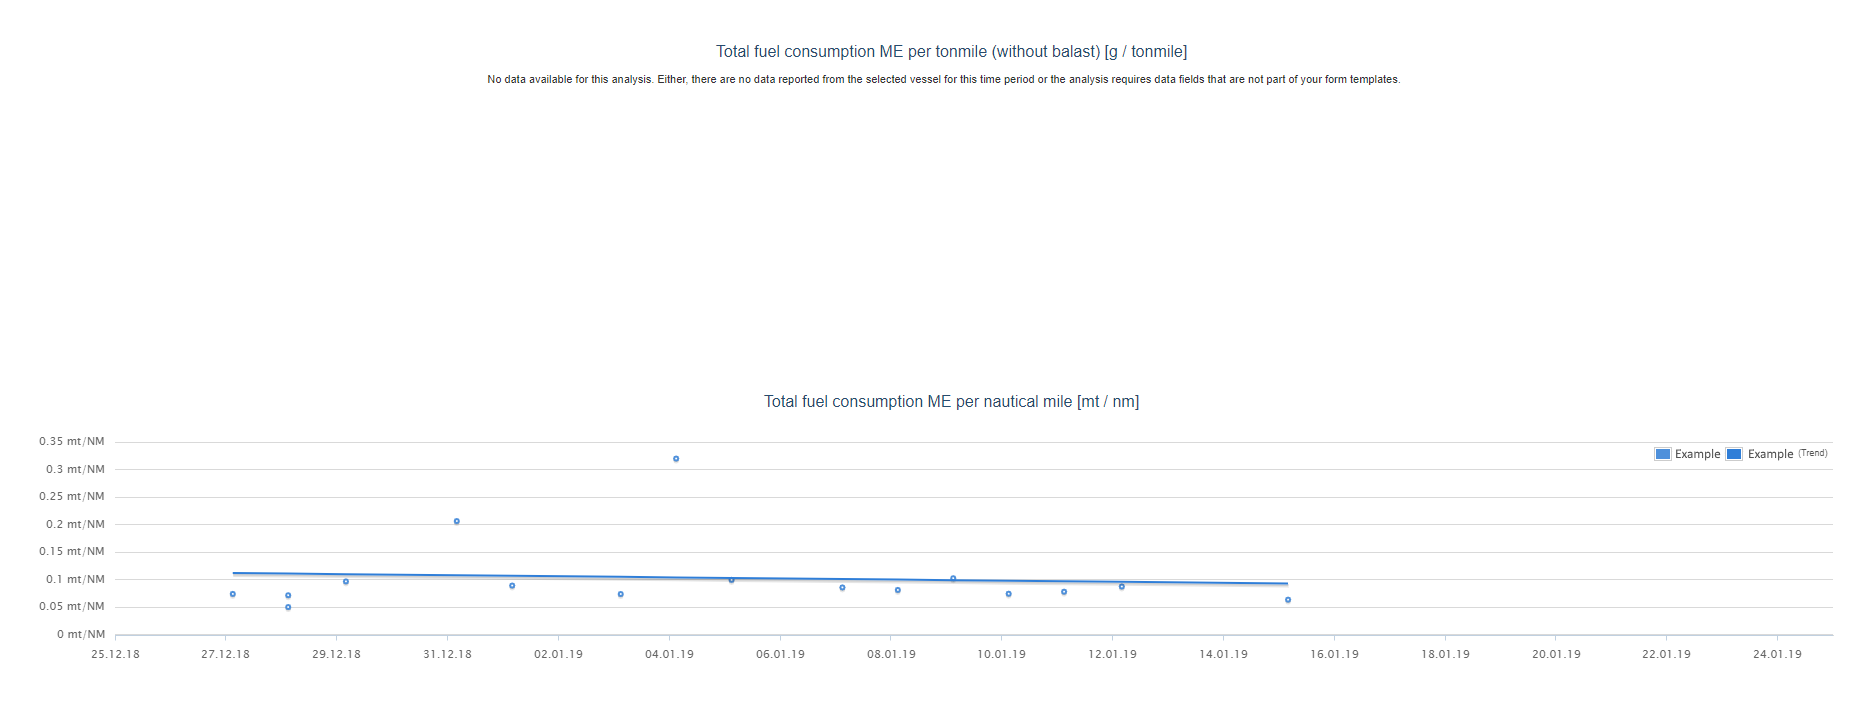
1. After clicking on “update” you get your results. This is an example of the results for one ship. The first chart does not appear, as there is not enough data for the ship in the reports. On the right side of the chart is the explanation of the colors.
2. If you change the charts for your analysis, you get different results after clicking on “update”.
3. If you choose more than one ship, the chart will show more results. On the right side is an explanation, which color aligns with which ship.
![]() 4. By clicking on the left button of your mouse and holding it down, you can mark certain areas of the chart.
4. By clicking on the left button of your mouse and holding it down, you can mark certain areas of the chart.
![]() 5. Now you zoomed into that marked area. To get back to the normal view, you can just click on the button “zoom-out”.
5. Now you zoomed into that marked area. To get back to the normal view, you can just click on the button “zoom-out”.
